Perf-icient Measuring of Laptop Energy Consumption and CO2e

Perf-icient Measuring of Laptop Energy Consumption and CO2e
Edited by Jessica van der Berg
8 min read
Recently I attended the SDIA Green Coding Summit in Berlin. From the engaging panels to the informative talks and immersive bootcamps, this event stands out as one of the most meaningful I’ve ever attended. Presenters and attendees alike exuded passion and their desire to share knowledge; working to gain momentum in bringing awareness to green coding and the like.
The second and final day, Green Coding Berlin’s Arne Tarara led a bootcamp on the Green Metrics Tool , a benchmarking tool that provides developers the means to measure and understand the carbon emissions of their software. During the session we used gradient-boosting decision trees (ML) to measure the energy consumption of running processes. It was awesome.
Taking inspiration from the bootcamp, I decided to play around with measuring the power and energy consumption of various loads running on my laptop. Then, using those numbers, calculate the CO2e at that moment in time (excluding embodied emissions).
Initially I thought this would be a relatively trivial task: utilize system functionality to read power consumption of various loads. Simple right?
Oh, was I wrong.
I started by measuring consumption with perf, but after much reading, running, and calculating I was not confident in the numbers I was getting. They seemed extremely low compared to some of the averages I was finding online.
So of course I started questioning:
- my calculations from Joules to kWh
- the perf arguments, and what is being measured
- the accuracy of RAPL
- my sanity and career choices
After much digging, I have come to more of an understanding. My hope is that this will help others not pull out alllll their hair.
Perf
To begin my journey of measuring energy consumption I utilized the perf
command. Perf is a Linux-specific tool that is typically used for profiling and performance measuring. The perf argument, stat (when running perf stat) takes an option -e --event <event> that refers to the specific software, hardware, kernel PMU, etc, event(s) to count. To view all available events run: perf list, and to measure multiple events in a single call pass: -e cpu-cycles,instructions ...
In the use case of measuring energy consumption, perf is essentially a wrapper for the Intel Running Average Power Limit (RAPL ) hardware feature. It provides a few events to measure energy:
$ perf list | grep power
    power/energy-cores/                                [Kernel PMU event]
    power/energy-gpu/                                  [Kernel PMU event]
    power/energy-pkg/                                  [Kernel PMU event]
    power/energy-psys/                                 [Kernel PMU event]
    power/energy-ram/                                  [Kernel PMU event]
Minimal load
For my use-case, I applied the energy-pkg event, which measures the processor package (core and uncore), and the energy-cores events.
sudo perf stat -a -e power/energy-pkg/,power/energy-cores/ sleep 60
The -a option refers to a system-wide collection from all CPUs, and I believe is the default for these events.
The sleep 60 is the command that perf is monitoring, i.e., the power consumption of my idle system. Also, don’t forget the trailing / when listing the events, otherwise you’ll get a syntax error :)
During the execution of the 60 second sleep, my average CPU load was 0.68 as specified by the uptime command, or top.

The top CPU load average is for 1m, 5m, and 15m respectively
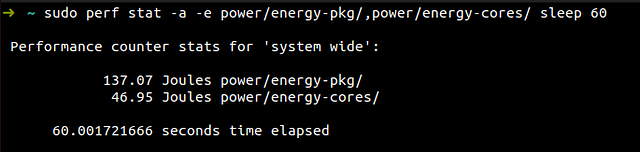
To measure the power consumption of my system I focused more on the energy-pkg results. To get energy consumption, the Joules output needed to be converted to kilowatt-hours (kWh), and was calculated as follows:
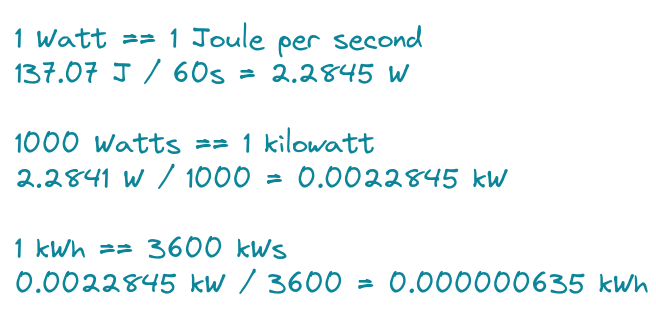
Thus, the energy consumption is 0.000000635 kWh for pkg and 0.000000217 kWh for cores.
This is a relatively small amount of energy being consumed. It’s similar to that of a clock radio, or a phone charger. Naturally, with such low usage, I wanted to see what the power consumption would be under higher load.
Increasing Load
I wanted to see how different the consumptions would be if I stressed with various CPU load %. I used stress-ng which is used to stress test a system with bogus inputs to add load to different components.
Note: these numbers aren’t exact, I did have other processes running that may contaminate results (however, those processes were relatively consistent across all tests).
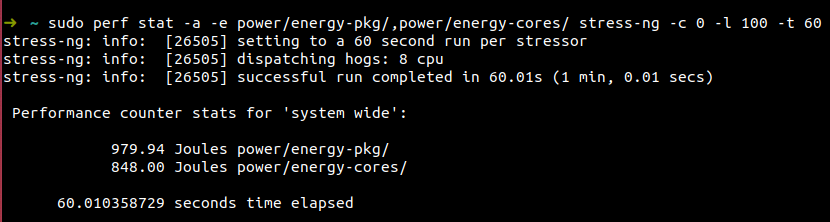
sudo perf stat -a -e power/energy-pkg/,power/energy-cores/ stress-ng -c 0 -l 50-t 60
The -c option specifies how many stressor processes that align with the number of CPUs. I decided to stress all 8 of my CPUs at -l load percentage for -t amount of time.
50%
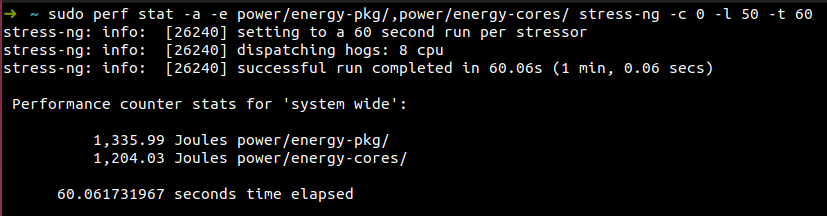
pkg: 0.000006185 kWh
cores: 0.000005574 kWh
75%
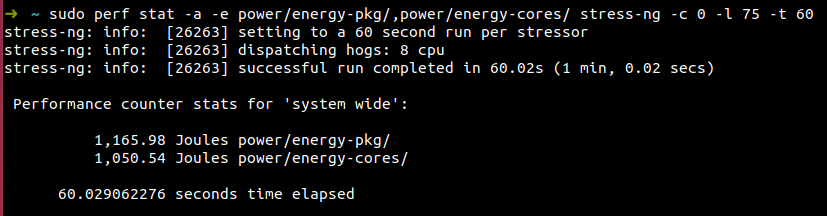
pkg: 0.000006185 kWh
cores: 0.000005574 kWh
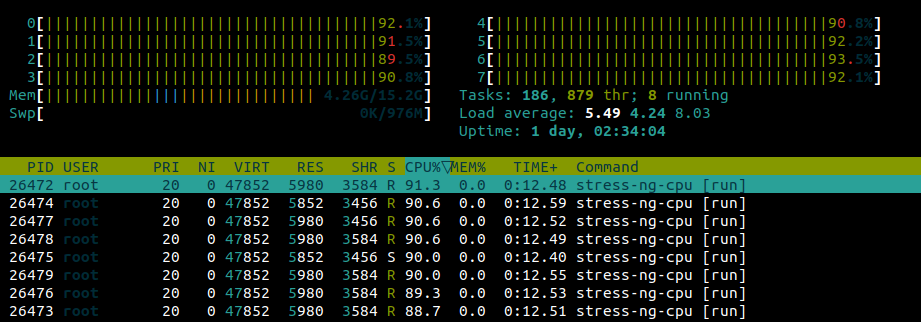
85%
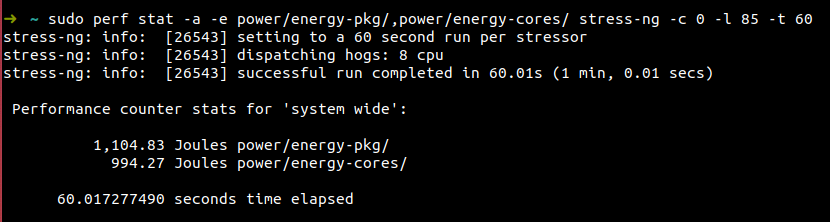
pkg: 0.000005115 kWh
cores: 0.000004603 kWh
90%
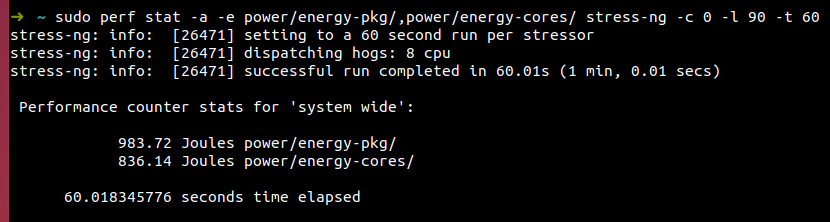
pkg: 0.000004554 kWh
cores: 0.000003871 kWh
100%
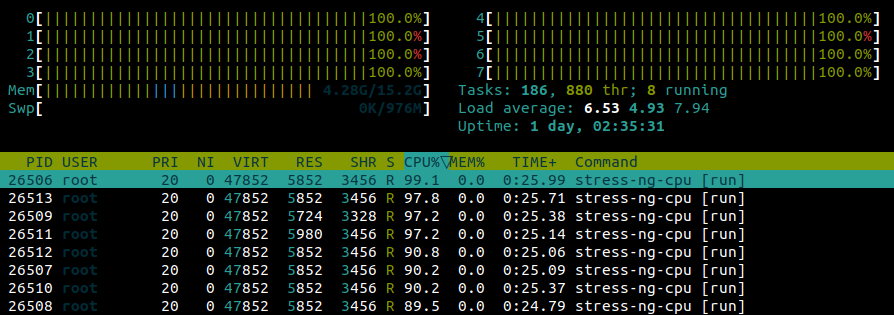
pkg: 0.000004537 kWh
cores: 0.000003926 kWh
Comparison
To get a more comprehensive overview of the data, here is a table of CPU loads and energy consumption values:
| Load % | energy-pkg (J) | energy-cores (J) | energy-pkg (kWh) | energy-cores (kWh) |
|---|---|---|---|---|
| 0 | 137.07 | 46.95 | 0.000000635 | 0.000000217 |
| 50 | 1,335.99 | 1,204.03 | 0.000006185 | 0.000005574 |
| 75 | 1,165.98 | 1,050.54 | 0.000005398 | 0.000004864 |
| 85 | 1,104.83 | 994.27 | 0.000005115 | 0.000004603 |
| 90 | 983.72 | 836.14 | 0.000004554 | 0.000003871 |
| 100 | 979.94 | 848.00 | 0.000004537 | 0.000003926 |
As you can see, the energy consumption is not increasing linearly as CPU load increases. This may seem counterintuitive, but it is actually due to a phenomenon called energy proportionality.
The rate at which work is being done is not proportional to power consumption; therefore more workloads running on the CPU does not equate to a similar increase in power consumption. Think about this next time you’re buying more servers; it may be more carbon efficient to instead increase CPU utilization.
Carbon Emissions
Now that I know how many kWh these workloads produce, I can use this to calculate the amount of carbon emissions.
To understand the relationship between electricity and carbon, I found the Green Software Practitioners learning to be helpful. They mention “Electricity is considered a proxy for carbon”. This is because electricity is powered by fossil fuels (coal, oil, natural gases, etc.), and they are the most significant producers of carbon emissions (GHG/CO2e).
To do the actual calculations, I utilized Green Coding Berlin’s formula , which multiplies energy production by carbon intensity. Carbon intensity measures the amount of carbon (g) released into the atmosphere per kilowatt-hour (kWh) of electricity.
To get the carbon intensity of a specific location, electricity maps
are helpful. I used the carbon intensity of 1371g/kWh since that was the rate in the Netherlands at the time of performing the benchmarks.
To get the CO2e of the 50% load for the processor package, it would be:0.000006185 kWh * 371g/kWh = 0.002294635 grams of CO2e
In other words, if I ran at 50% CPU utilization for an 8 hour day, I would produce 0.01835708 grams of CO2e.
For a 40 hour work week, I would produce 0.0917854 grams of CO2e.
And for a 40 hour work week, over 52 weeks I would produce 4.7728408 grams of CO2e.
Here is the same load table as above, but with the CO2e factored in:
| Load %-ish | energy-pkg (J) | energy-pkg (kWh) | Carbon Intensity (g/kWh) | CO2e (1h) | CO2e (1w) | CO2e (1yr) |
|---|---|---|---|---|---|---|
| 0 | 137.07 | 0.000000217 | 371 | 0.00023543 | 0.00941722 | 0.489695 |
| 50 | 1,335.99 | 0.000006185 | 371 | 0.00229469 | 0.09178746 | 4.772948 |
| 75 | 1,165.98 | 0.000005398 | 371 | 0.00200268 | 0.08010714 | 4.165572 |
| 85 | 1,104.83 | 0.000005115 | 371 | 0.00189765 | 0.07590591 | 3.947107 |
| 90 | 983.72 | 0.000004554 | 371 | 0.00168963 | 0.06758521 | 3.514431 |
| 100 | 979.94 | 0.000004537 | 371 | 0.00168314 | 0.06732551 | 3.500926 |
With the direct proportionality of energy consumption, less carbon is being released into the atmosphere with higher CPU load. It is better for the environment to have fewer servers running at higher utilization.
Conclusion
I initially started this blog to continue my learnings gathered from the SDIA bootcamp in computing power consumption and carbon emissions. After running and calculating various workloads, and without my intention, it turned into an example on energy proportionality. Now I am curious as to what the “sweet spot” may be on CPU utilization; maybe incorporating CPU saturation may be key in determining when utilization truly is too high. Sounds to me like there’s much more to learn.
Uncertainties
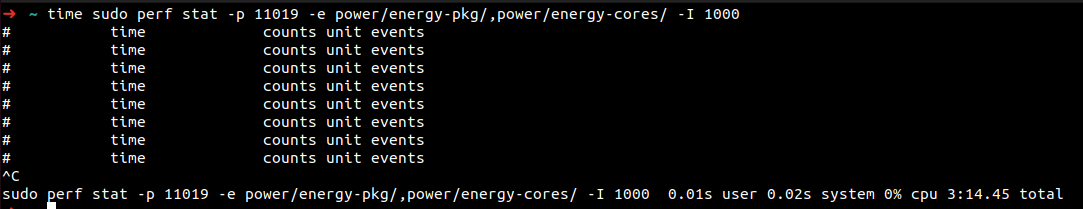
I had the misconception that perf was measuring the performance of my entire system throughout the execution of the specified command, but not solely the process itself. It came from the output: “Performance counter stats for ‘system wide”, and when I tried running with the -p option. I ran a sleep 3600 and then used ps elf | grep sleep to get the PID of that process, then tried running
perf stat -p <PID> -e power/energy-pkg/,power/energy-cores/ -I 1000
The -I prints results every ms specified, so in this case every 1 second. However, it was not returning any measurements, nor was it outputing every second (this was over 3 minutes of execution).
I’m not confident in why this is happening, I have some assumptions, but if anyone has any input, I would love to hear it, and I’ll update the post with additional information as I keep looking into it. (But if I waited to post this blog until I had all the information…well, there would never be a post 😅).