Follow the Sun: Greening the IT Landscape, One Sunrise at a Time

“Follow the Sun” sounds like ambiguous guidance from Yoda. It is also:
- An indie song reminding you to be present.
- An epic road trip strategy.
- An SRE support strategy where you have support personnel across the globe in different time zones so that no matter the time a query comes through, there’s someone to handle it
- Or my new favourite, the green computing “Follow the Sun” objective. This is where we follow the sun as we use it to power our workloads!
What is following the sun?
The Follow the Sun strategy in green computing revolves around the creation of carbon-aware and carbon-responsive applications. When looking at electricity grids, you’ll see fluctuations in carbon intensity throughout the day, with higher levels at certain times and lower levels at others. This concept in green computing draws inspiration from solar energy practices, especially in regions relying on solar power. While the Sun shines, these regions inject a surplus of renewable energy into the power grid. However, as the sun sets, the grid progressively shifts towards dependence on fossil fuels to meet energy demands.
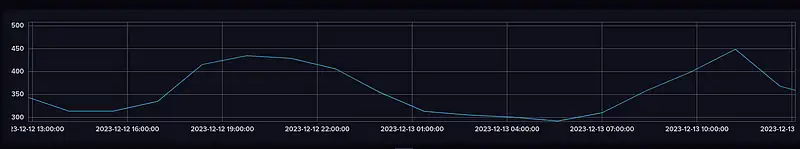
Now, Follow the Sun is not only about solar energy. It’s an encompassing term for all renewable energy sources (Wind, Hydro, Solar, etc.), with the idea to move workloads to regions where the carbon intensity is lower or to delay processes in a region until its carbon intensity dips. A graph of carbon intensity look something like this
What is Carbon Intensity?
When we talk about carbon intensity in terms of electricity, we need to understand that most electricity grids have various types of energy pushed into them. Some of those are greener than others, but also more dependable than others.
If we have a very fossil fuel-dependent energy grid as such:
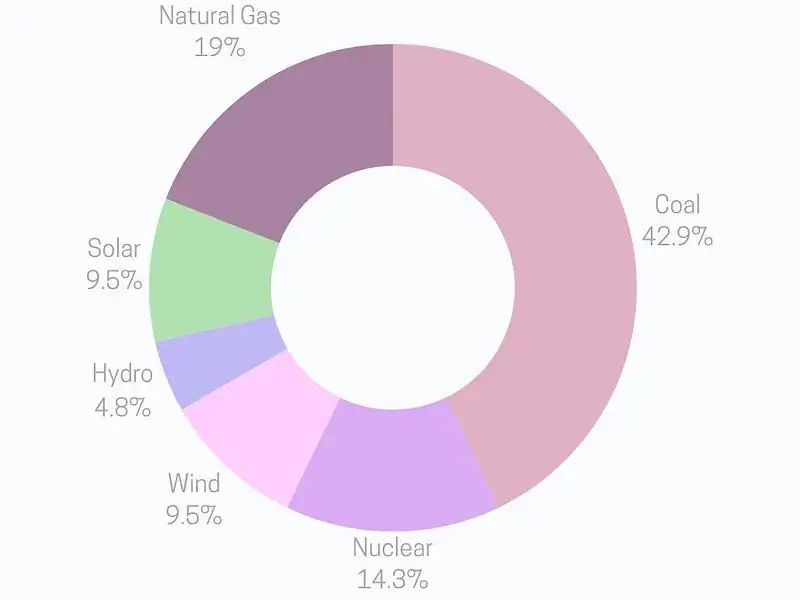
…it means that the carbon intensity is high, as it creates more carbon emissions per kilowatt hour. Whereas, a low carbon intensity energy grid would have a bigger spread of green energy sources as such:
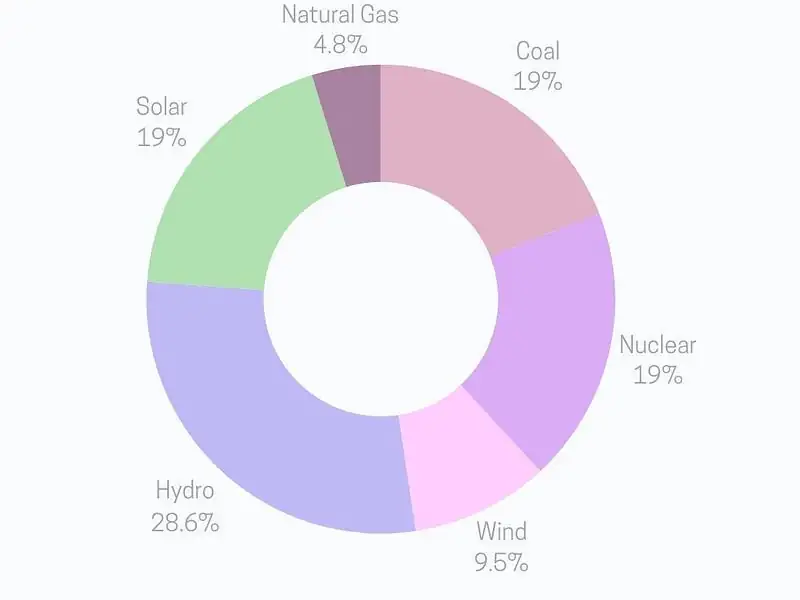
In some regions, like South Africa, you are getting around 650g CO₂eq per kilowatt-hour, whereas in much greener regions, like Norway, you can get as low as 22g CO₂eq per kilowatt-hour.
How do I know when the carbon intensity in a region is lower?
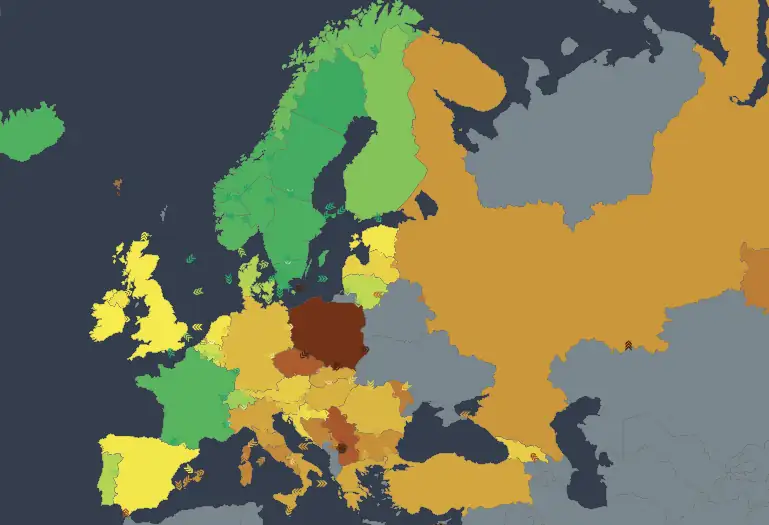
Luckily for us, electricity grids have been the focus of greener practices for a while. There is an ingenious tool called Electricity Maps that gives you an overview of just how many grams of carbon are being pumped into the atmosphere for every kilowatt hour generated. And the best part is… they have an API! Oh, my little tech-ie heart. Below you can see the map and notice the regions with “greener” energy:
I’ve mentioned in previous blog posts (like the one on LLM’s ), just how much changing your region can impact your carbon emissions, but there are also some potential downsides to this strategy.
Some of the social implications of shifting workloads to different regions
Demand needs to meet supply. If this doesn’t happen, someone ends up short. When thinking in terms of scale, small problems always grow rapidly and without warning. In the case of shifting workloads, if everyone were to shift workloads too quickly you would have something called the “thundering herd ” problem; a race to utilise resources. This is a common problem in workload scheduling. The idea here is that “green” electricity resources would be used by foreign companies trying to reduce their emissions factors, leading to such high demand that the region would potentially need to start utilising fossil fuels to keep up. In essence, making the region’s electricity grid dirtier.
Dirtying the electricity grid is only one downside. There are many more potential negative socio-economic effects of under-considering “green” data centre building. Corrupt governments, misusing land for renewable energy initiatives, no sustained plans for maintenance… the list goes on.
However, another potential outcome, and this time, a positive one, is that as data centres in a region become more popular, there will be an influx of money and jobs (perhaps more money than jobs, with current data centre automation).
This is already being done and we’re seeing the economic boosts from this approach. A great example is the recent strides Rwanda has made with renewable energy initiatives. Their holistic approach (governmental commitment, increasing energy access to rural areas and a range of renewable initiatives) is resulting in massive growth for the country–making it an attractive region for data centres. We’re watching this pan out in real time. Kigali Data Centre in Rwanda is designed to be one of the most sustainable data centres in the world. And I’ve got a feeling that this is just the beginning.
Final Thoughts
Carbon-aware workloads are on the horizon.
As we think about where to deploy and whether we take the effects on local communities into consideration before or after issues come up still relies on implementation details, but I do not doubt that, as has happened countless times, the tech industry will innovate and optimise.
Until then, wherever possible, think about the people. Think about the planet. It’s not that radical.