A Christmas Tree Carbon Story

A Christmas Tree Carbon Story
My partner LOVES Christmas time. The lights, the markets, finding the biggest tree (then carrying that son-of-a-gun home), the city, the jumpers, the mugs, the themed socks… Actually, to put it into perspective, when moving to the Netherlands, 2 of our 10 boxes were solely for Christmas decorations.
This year I’ve started looking at this practice through a more environmentally-conscious lens. So naturally, I’ve decided to look at hardware energy consumption tracking.
How much does this simple (but oh-so-wonderful) tradition contribute to climate change? With the scale factor of millions of homes, I became a bit obsessed with this thought, so like I’ve been tending to do recently, I started to research and experiment a bit.
Growing a Christmas tree
Growing a Christmas tree is carbon negative because the photosynthesis of growing the tree absorbs CO² which means while the tree is in the ground and growing, it consistently removes Carbon Equivalent Emissions (including methane and ozone) from the environment. Alongside this, one hectare of Christmas trees will produce enough oxygen daily for 44 people for as long as the trees are alive (how awesome is nature?!)
The downside to this is that the carbon that the trees absorb will be released if they are burned at the end of their life cycle. The better way to get rid of your Christmas tree is to chip it up and add it as mulch to your garden (if you have one) which will very slowly release the gases, making the emissions negligible.
If you throw your Christmas tree in a landfill, it will produce roughly 16 kg CO²eq, while if you outright burn it, that will release 4 kg CO²eq. If you chip it up into mulch and use the mulch, you’re looking at 0 kg CO²eq
For my calculations, I’m going to go with the middle ground and work with 4 kg CO²eq.
Those dreamy (and pesky) lights
Now we start getting geeky. When measuring the emissions of your Christmas tree, you have to take the energy consumption of that tangled mess of wires you deal with every year called Christmas tree lights into account. For the Christmas tree I set up this year, we used 3 sets. They are all LED lights which means they generally use less energy.
But how to measure them?
Enter the Shelly Plug S , a smart home plug that gives you a nice app to tell you how much power whatever is plugged into it is using. This is cool, but let’s be honest, when you experiment you want to get your hands dirty, which is actually why I ended up picking this specific plug… it has a full API to utilise!
So once you set the plug up, you need to create something to poll this API and get the energy consumption which I did, of course. I created a small Golang application that continuously (every 3 minutes) fetches the energy consumption from the Shelly Plug (which gives you the last 3 minutes of consumption).
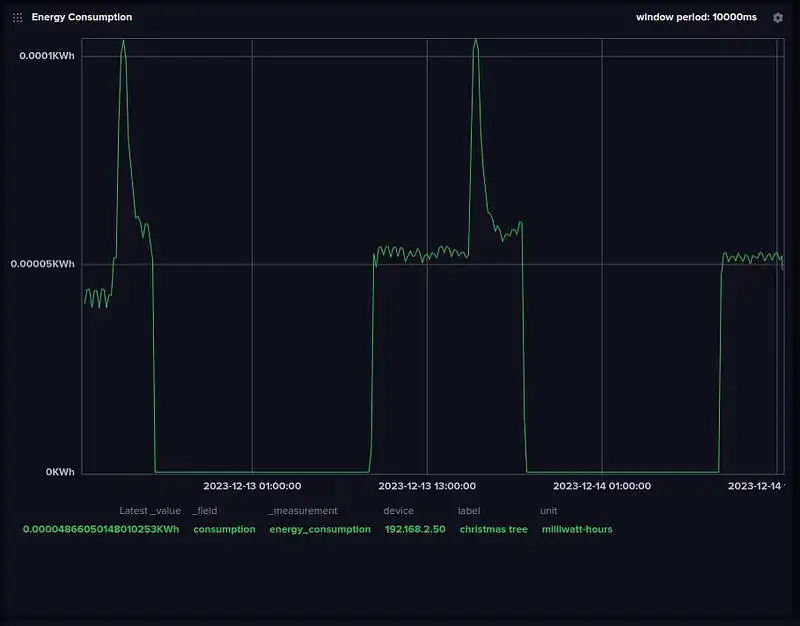
As we want real-time consumption, it’s easiest to use one of the awesome, real-time databases. I decided to go with InfluxDB because I’ve never used it and as it’s my experiment, I get to make unreasonable decisions. Luckily, InfluxDB comes with a nice UI to plot your data. So after all is set and my application is pulling the power consumption from the plug and injecting it into InfluxDB, you get a nice little graph giving you the power consumption of the Christmas tree lights.
From energy to carbon
The last missing piece of the equation is just how clean the energy I am using actually is. As you can imagine, different energy sources have different levels of emissions, and luckily for our super important experiment, there is a service that tells you how many grams of CO²eq is emitted per kWh of energy used, called Electricity Maps .
For our use case I can use the free tier, which has a limit on API calls, and every time the application fetches the energy consumption of the Shelly Plug, it also goes to Electricity Maps and looks for the carbon intensity of my energy grid at that time (I added a twenty-minute cache to the application as the carbon intensity does not change that often), which ended up giving me data that looks like this:
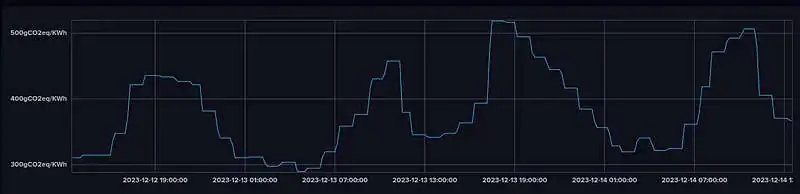
You might be questioning why carbon intensity is not a constant? Well to my understanding, the amounts of renewable energy that is in a grid fluctuate throughout the day due to its variance. For instance, when the Sun is out and bright, you will be benefitting from a bunch of solar energy, but once the clouds come and it starts raining, the energy will most probably be coming from another, more carbon-intensive energy source such as coal or gas. This means that using energy at certain times of the day will be less carbon intensive than at other times.
Now that we have this data, we can use a very simple formula to calculate our carbon emissions at a point in time.
CO²eq = Energy Consumption (KWh) * Carbon Intensity (g CO²eq/KWh)
The Final Result
After spending far more time than I’m proud of, learning how to mix these two data sets (energy consumption and carbon intensity) in a real-time stream, I finally came down to my final dashboard for carbon measurements of my Christmas tree lights:
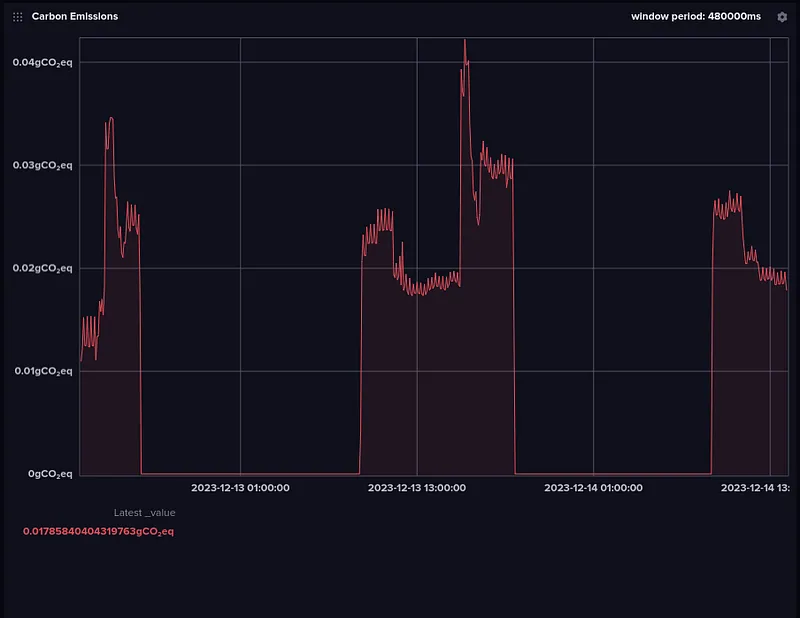
This gives me a nice real-time dashboard that I can watch, but what about the outcome?
I noticed that there was a trend in the emissions, and with forecasting and multiplication, I found that over a week, the lights emitted around 2.98g CO²eq a day, which comes to around 74.5g CO²eq for the period 1 Dec 2023–25 Dec 2023.
Add this to our embodied carbon (which we always should take into account) and you get 4.0745KG CO²eq for your festive season.
Okay, but how can I celebrate Christmas more sustainably?
Look at the lifecycle of your Christmas Tree. Consider where it will end up. More and more programmes are popping up to help. Use LED lights. I swear they get just as tangled as incandescent Christmas lights. In general, next time you’re tree hunting, or doing anything for that matter, think about the impact your actions have in our fight against climate change. A million small moves make a big difference.
If you’re curious about the carbon cost of any other activity, let me know. I might just experiment with it!