Baselines and Bottlenecks: Measuring Sorting Algorithms with the Green Metrics Tool

Measuring the energy consumption of your software is like
playing jenga
while getting a tattoo
from someone on roller skates.
It’s possible but woah, there are a lot of moving parts that affect every stage of the process.
To be more sustainable doesn’t necessarily mean you need to measure the energy consumption of your software, but you do need to understand it. If we have a good understanding of baselines and bottlenecks in our code we can immediately pick up when we release changes that have a negative impact on metrics.
We will be going through some of the difficulties of measuring software energy and show why measuring it is important using an example laid out in my previous article Rethinking Code Efficiency: Big O Notation, Sustainability, and the Path Forward .
The difficulties of measuring software’s energy usage
We can measure the energy use of our software in two ways; through software and through hardware. When measuring the energy usage of software using software, we generally end up using formulas to handle estimations, because there is not a lot of proprietary information available. We use the device specs to do estimates, generally looking at the Thermal Design Power (TDP) which gives a rough estimate of how much power your device uses per second:
Let’s look at my laptop as an example. I get the CPU information by running the following:
$ cat /proc/cpuinfo | grep "model name"
model name: Intel(R) Core(TM) i7–10510U CPU @ 1.80GHz
With this information, I can look up the specs of my processor from Intel (manufacturers have this information available).
Then look for the “TDP” in the list and you will see that my device uses around 15w per second:

This is an average approximation as this fluctuates as more of your CPU is utilised (mine utilises up to 25w per second).
In short, this is not as accurate as we would like.
The difficulties of measuring software energy usage through hardware
When measuring energy consumption of software through hardware, we get a very accurate measurement because we can measure the exact wattage going through specific pieces of hardware. In most modern-day devices, these features are actually built into your CPU (X86 CPUs from Intel and AMD) called Running Average Power Limit (RAPL). While you can enable them easily, there is some controversy around it, because of a security flaw and the fix distorts the signals; as explained in Green Coding Berlin’s case study by Arne Tarara, RAPL , SGX and Energy Filtering — Influences on Power Consumption .
One large drawback around hardware-based metrics? It’s near impossible to use these methods in a virtualised environment like the Cloud.
Introducing the Green Metrics Tool
The Green Metrics Tool (GMT) takes your specified workflow and using various sources (known as “Metric Reporters”) takes a baseline reading. It then runs your flows and again takes reading, giving you an understanding of the impact your software has on the system. While it can make use of concepts such as RAPL, what I find the most intriguing is that one of the providers uses a well-known machine learning model called XGBoost which has been trained on data from the SPEC Power Database .
This means it gives more accurate calculations than just using the TDP would.
Measuring coding (in)efficiencies
In my previous blog, we saw that Merge Sort is more performant than Bubble Sort. Now, to understand energy consumption, I created the following scenario:
“Given an unsorted list of integers with a length of 1000000, how much energy does it take to sort the list in ascending order?”
The parameters were as follows:
ListLength: 1000000
#Specifications of my laptop
XGBoostParameters:
    CPUChips: 1
    HW_CPUFreq: 1800
    CPUCores: 4
    CPUThreads: 8
    TDP: 15
    HW_MemAmountGB: 16
    Hardware_Availability_Year: 2020
I then ran the list through three different algorithms:
- MergeSort (O(n*Log n))
- BubbleSort(O(n²))
- InsertionSort(O(n²))
I used two algorithms with the same complexity to see if there were differences in energy consumption.
Keep in mind that the nature of this experiment might be biassed towards one algorithm as the list could be ordered in such a way that it might be one algorithm’s best case scenario and another algorithm’s worst case scenario.
You can find the code here with my configuration of the Green Metrics Tool here (I followed the installation guide ).
Luckily, GMT has a very cool UI for comparing different runs:
Bubble Sort vs. Insertion Sort
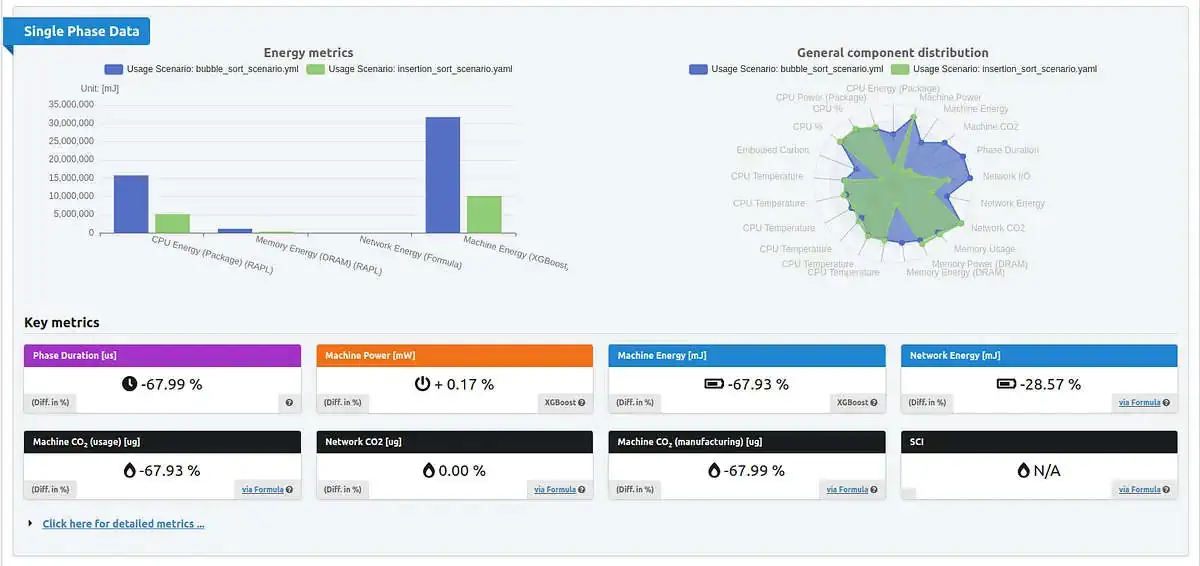
Surprisingly ( to me, at least) the Bubble Sort algorithm is more energy-intensive, showing that sorting the same list takes close to 70% more energy than Insertion Sort, even though both algorithms have the same complexity. I would contribute this heavily towards the Insertion Sort method running for around only seven minutes while the Bubble Sort algorithm ran for around 24 minutes. I assume that as it runs longer, it requires more energy. This seems like it’s due to the high number of swaps.
Insertion Sort vs. Merge Sort
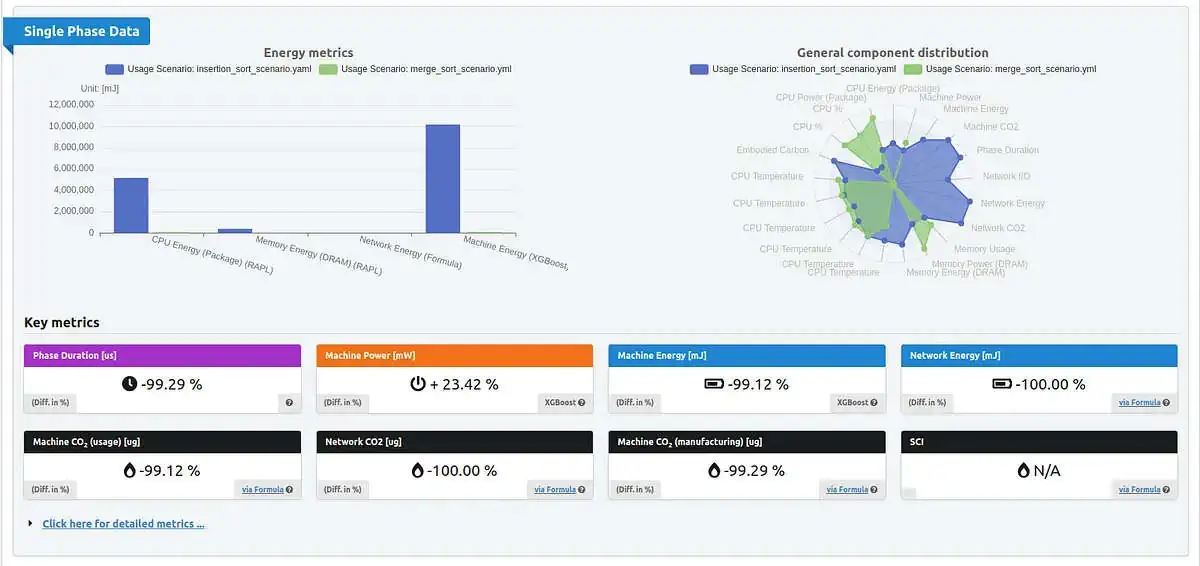
Buckle up. This is where the really wild metrics come in.
Merge Sort is the more performant algorithm. When running the scenario, it used 89.09 joules of energy, while Insertion Sort used 10176.86 joules.
Let’s look at that again: doing the same task, using less performant code uses close to 115 times more energy.
Bubble Sort vs. Merge Sort
 Now for the two ends of the spectrum. Bubble Sort, being the worst-performing algorithm in this scenario, used around 31737.32 joules for the task, making it 356 times more intensive than Merge Sort.
(This experiment is just a quick look and would need to be run multiple times using different lists to compare the final efficiencies).
Final thoughts
When looking at improving software, the words of Lord Kelvin constantly echo in my mind, “If you cannot measure it, you cannot improve it.” We are slowly diverging towards being able to track energy efficiency in software reliably but there are still many barriers.
However, with the tooling we have now, it’s clear that your coding can have a drastic impact on energy, and with a drastic impact on energy comes a drastic impact on the environment. By changing the way we code and implementing tools like the Green Metrics Tool as part of our development process we can start to reduce the negative impact that the tech sector is having on the planet.